e0364b99-bc1e-4db7-802b-9945f94374ec|8|4.9 |
13. March 2010 21:55
|
There have been some questions about how to debug when developing DotNetNuke modules. If you have followed my module development tutorial series you know you can’t just start a debugging session for the module project.
To debug your module code you have to attach the debugger to the process actually running the code. Since the development website is running on your local webserver, that process is the IIS worker process.
Before you start debugging, make sure the module is installed on the development website and that the control you want to debug is added to a page on the website (so the code we want to debug is run when we enter that page).
Open up the development website in your browser to make sure the webserver worker process is running. Open up your module project in Visual Studio.
In the Debug menu, select Attach to process…
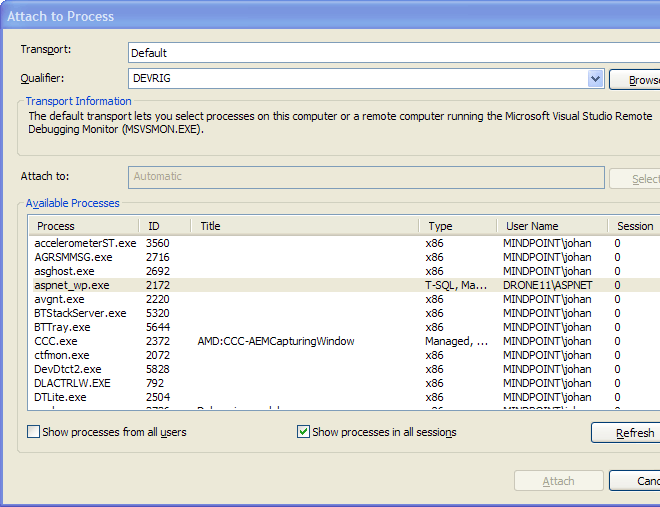
In the Attach to process dialog, select aspnet_wp.exe from the Available processes list and click the Attach button.
The screenshot below is from an XP machine. If you use Vista or Win 7, the name of the worker process is w3wp.exe.

Now execution will stop at any breakpoints in your code, just as usual.
Try it out by setting a breakpoint in the Page_Load method in ViewProducts.ascx.cs and surf to the page where you added the module.
When you are done debugging, go into the Debug menu again and select Stop Debugging.